
Analysing Databricks Scheduled Workflows using REST API
Many organisations run hundreds of automated workflows, from ingesting raw data to transforming it into analytics-ready datasets. These workflows are scheduled to run on specific clusters at designated times. However, as the number of jobs grows, manually tracking them becomes nearly impossible.
This challenge inspired the idea of workflow analysis. I wanted a solution that would allow me to:
Identify which jobs are running successfully and which are failing.
Determine whether clusters are underutilised or overburdened.
Measure the time and resources consumed by each workflow.
Detect recurring patterns of failures that need attention.
Monitor whether any job ran longer than its usual average today.
These questions led me to explore and implement a solution that could address them effectively.
To tackle this, I turned to Databricks REST API, which provides programmatic access to all the job and cluster metadata in my workspace. Using this API, I could fetch information about every scheduled job, including its execution history.
The goal was to automate workflow analysis so I could gain a complete picture of my pipelines without manually checking each job.
Why is workflow analysis Important?
Ensure Reliability
In production environments, even a single failing job can delay analytics and reporting. Workflow analysis helps identify frequently failing jobs before they become critical issues.Optimise Resources
Clusters are expensive. Knowing which jobs run on which clusters and for how long helps in cost optimisation and prevents idle or overloaded clusters.Monitor Performance Trends
Tracking job duration and success rates over time reveals patterns or anomalies—for example, jobs taking longer after a schema change or cluster upgrade.Enable Data-Driven Decision Making
By converting raw job metadata into dashboards, alerts, and reports, teams can proactively improve pipelines rather than reactively fixing issues.
How Databricks REST API Helps
Databricks REST API provides endpoints to:
List all jobs in your workspace
Fetch recent runs for each job
Create your analysis report to grab the insights
With this data, you can build automated analysis scripts, dashboards, and alerts, turning raw job logs into actionable insights.
REST(Representational State Transfer) is an architectural style for designing web services that allows different systems to communicate over the internet used HTTP protocols.
Understanding REST API in simple terms: Think of REST API like ordering at a restaurant. The Customer(You) want something from the kitchen(the server). You cannot just walk into the kitchen and grab food yourself. Instead, you use a waiter(the API) to communicate your requests.
There are different methods to communicate your requests.
GET : Retrieve data-only, In our example its like “show me the menu”
POST: Create new resources, like “I want to place a new order”
PUT: Update existing resources , “Change my order to something else instead”
DELETE: Remove resources , “Cancel my order”
A REST API is simply a way for different computer programs to talk to each other over the internet.
Lets now see how to retrieve Databricks job information using REST API
My code sets up API access to a Databricks workspace using a Personal Access Token (PAT). It retrieves the workspace URL from spark configuration and creates authentication headers for the REST API calls.
I have used two specific REST API endpoints to retrieve the job information
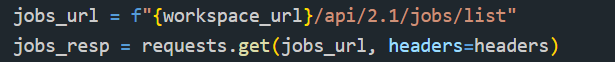
Job List Endpoint - This gets a list of all jobs in the workspace API Endpoint /api/2.1/jobs/list. The HTTP method ‘GET’ brings all the job-related information along with the configuration details
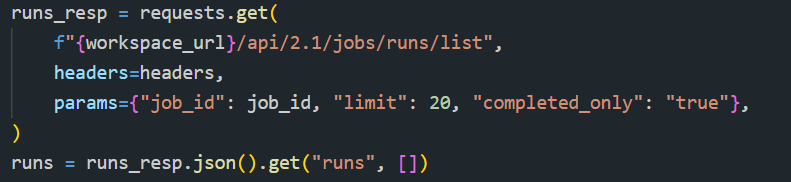
Job Runs List Endpoint - This is used to get execution history for a specific job API endpoint: /api/2.1/jobs/runs/list. I have asked it to retrieve the information for the last 20 runs of each job for all completed ones.
Bringing It All Together: Automating Workflow Analysis
Once I had access to both job definitions and job run history, I could start connecting the dots.
For each job in the workspace:
I pulled its configuration (name, schedule, runtime ).
I fetched its most recent execution history.
I calculated key metrics such as:
Success vs failure rate
Average run duration
Longest and shortest execution times
Today’s runtime compared to historical averages
Wrapping up:
Workflow analysis isn’t just about visibility; it’s about control. With the Databricks REST API and a small layer of automation, operational metadata can be transformed into meaningful insights that improve reliability, performance, and cost efficiency across your data platform. Instead of reacting to failures after they happen, you gain the ability to spot patterns early, understand how your workflows behave over time, and make informed decisions about your pipelines and clusters.
If you’d like to explore the implementation in more detail, including how the job metadata is collected and analysed, you can find the full code and project structure on my GitHub page.
Thank you for reading through. I’ll be sharing more hands-on Databricks projects, real-world platform use cases, and practical data engineering insights in upcoming posts, so stay tuned. Until then #HappyLearning!