Databricks - Unity Catalog Metric Views
Are you a BI professional who’s ever felt frustrated when two dashboards report different numbers for the same metric? Marketing shows one revenue figure, Finance reports another, and your data team insists both come from the same table. Sound familiar?
If it does, let’s explore a little on why this happens.
On paper, everyone wants a single, trusted number for each metric. In reality, however, analysts often create their own calculated fields for dashboards, Finance teams build their own versions, and slight variations creep in across other teams and therefore leading to inconsistent numbers across the organisation.
To tackle this, we started by implementing centralised views/tables.
The idea is simple: create a single SQL view that aggregates and organises your data, so everyone pulls from the same source instead of writing their own queries. It could be for each service line or just for multiple small business functions.
And this is how it looks - You have a Data Layer with three stages- Bronze, Silver, and Gold, where raw data is progressively cleaned, transformed, and enriched. The Gold layer feeds into a centralised view for each service line or business function. This view serves as a single source of truth for any business metrics.
At first glance, centralised views seem like the perfect solution. They reduce duplicated SQL, provide a single source of queries, and simplify our pipelines. But there’s a subtle problem- while the SQL logic is centralised, the business meaning of each metric is not.
That is exactly where Metric Views come into place; they sit on top of the Gold tables and add business logic back into your metrics.
Databricks Metric Views
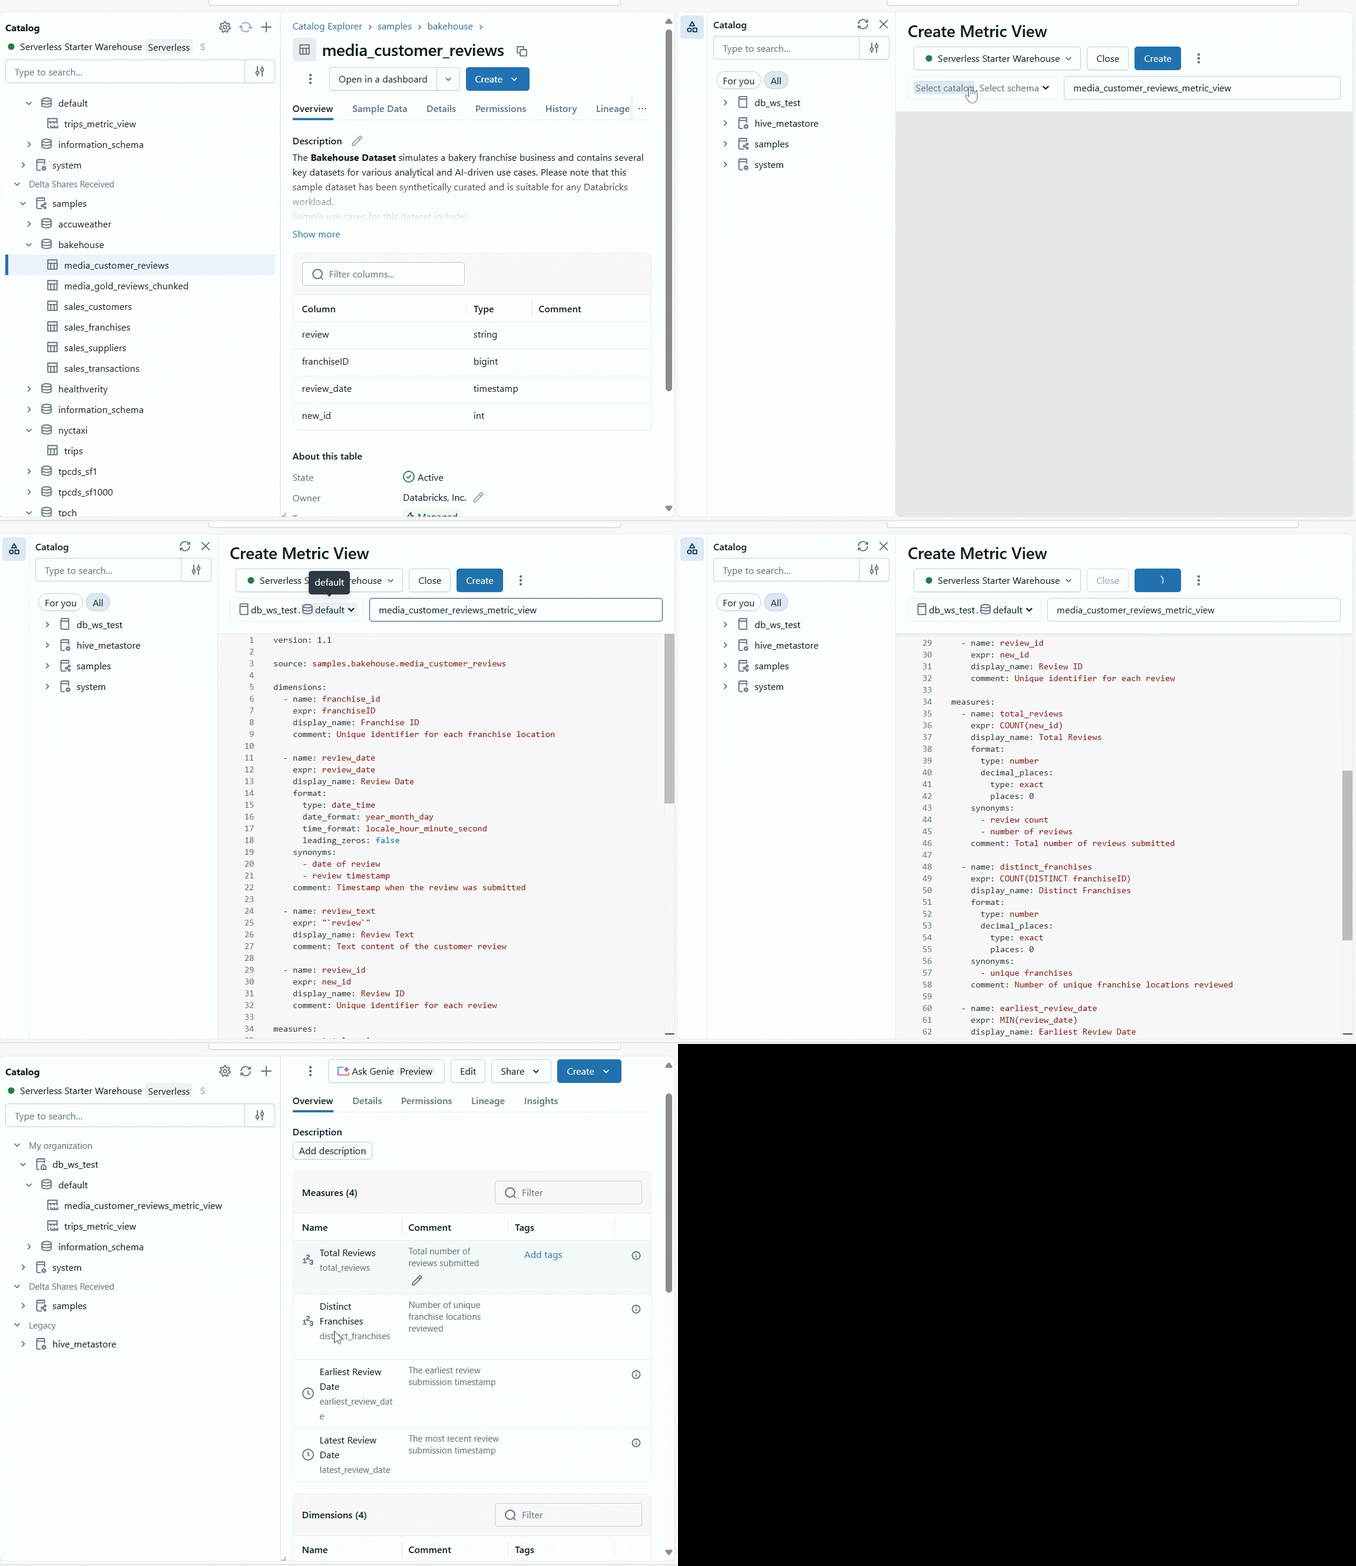
Databricks Metric Views are a way to define metrics once, govern them centrally, and ensure consistency across every dashboard or tool. Metric Views are defined in YAML and are registered in the Unity Catalog. We can create using SQL or directly from the UI, these can be queried using SQL. The UI even auto-generates the corresponding YAML definition, as shown in the GIF, which you can later fine-tune to match your specific requirements.
Why this matters:
Consistency across teams: Everyone uses the same definition for metrics, so there’s no mismatch between dashboards or tools.
Support for complex calculations: Handle tricky measures like ratios or distinct counts that can’t be safely re-aggregated in normal views.
Flexible exploration: Metric views play well with star and snowflake schemas, letting you navigate multi-level joins without extra work.
Ease of use with governance: Analysts get flexibility and simplicity, while SQL remains transparent and well-governed.
How are they defined:
Each measure (like total_reviews or distinctfranchises) gets stored as a metric definition that includes:
The aggregation function (
SUM,AVG, etc.)The filters or WHERE clauses
The data source
The default dimensions (review_date)
Any Synonyms you wish to add -you’ll discover how useful these are when you use Genie with Metric Views
Several other options
How to Query Metric Views:
You just have to use your SQL query to query metric views like how you query your tables. We select the required dimensions, use measures and group by the dimensions.
Metric views don't support SELECT * queries. Measures are aggregations that must be explicitly referenced by name using the MEASURE() function, so you must specify the dimensions and measures you want to query.
I have just given you a simple example, and there is a lot of potential that it can scale up your query execution even when you create complex metric views, and most importantly, they are defined once and can be used multiple times.
Wrapping up:
Metric Views aren’t just another Databricks feature, they’re a shift in how we think about data trust. By separating how metrics are calculated from where they are stored, we finally get to speak the same analytical language.
And with Genie, this consistency becomes conversational. Imagine asking, “What’s our average revenue per service line this quarter?” and knowing that every number Genie brings back is accurate, consistent, and trusted across your organisation.
That’s the real goal, not just centralised data, but centralised meaning. Metric Views are a quiet revolution in getting there.
Thank you for reading! Stay tuned for more interesting insights and use cases around Databricks and modern BI.


